The winter 2019 issue featured a spread on story ideas related to climate change.
Climate change, the environment: story ideas
BY MAI HOANG
A quick look at climate change coverage in school newspapers, and even some local newspapers, shows that the issue is most featured in the “Opinions” section. Passionate student writers would outline facts and arguments about a national climate issue, hoping to convince the reader. Another common type of article is the “events” article, which may cover the content of a climate scientist’s speech during a school’s Earth Day, for example.
Missing still are in-depth, or “long form” articles, that give the readers a comprehensive view of climate change in their community and school. These stories, while definitely more challenging for the student writer, are also infinitely more rewarding when done well.
Below is a compilation of story ideas for the aspiring climate journalist who wants to tell stories that will have an impact. Of course, these are merely suggestions, and there are infinitely many more stories that need to be told surrounding climate change, climate impact and climate action. However, the list below shall serve as an adequate starting point for students to begin investigating.
Each story idea in this story spread includes two main sections: The Basics and The Creative. In the Basics, you will find suggestions for angles to frame your article, sample questions to ask yourself and your interviewees and suggestions for reliable sources. The Creative is for those who want to go further, increasing audience engagement via eye-catching graphics and multimedia devices.
The culprit story
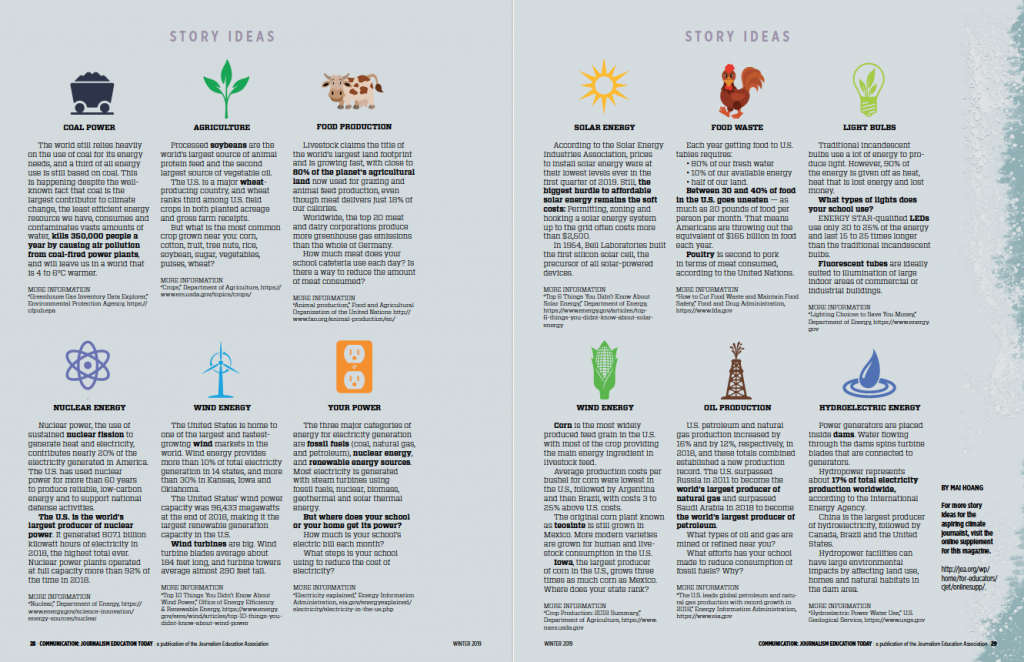
Who are the culprits behind increasing greenhouse gas emissions and global warming? Check the EPA’s Greenhouse Gas inventory to find out. We’re tracing some of the major polluters and how you can frame articles surrounding them.
COAL POWER (AND OTHER FOSSIL FUEL PROJECTS)
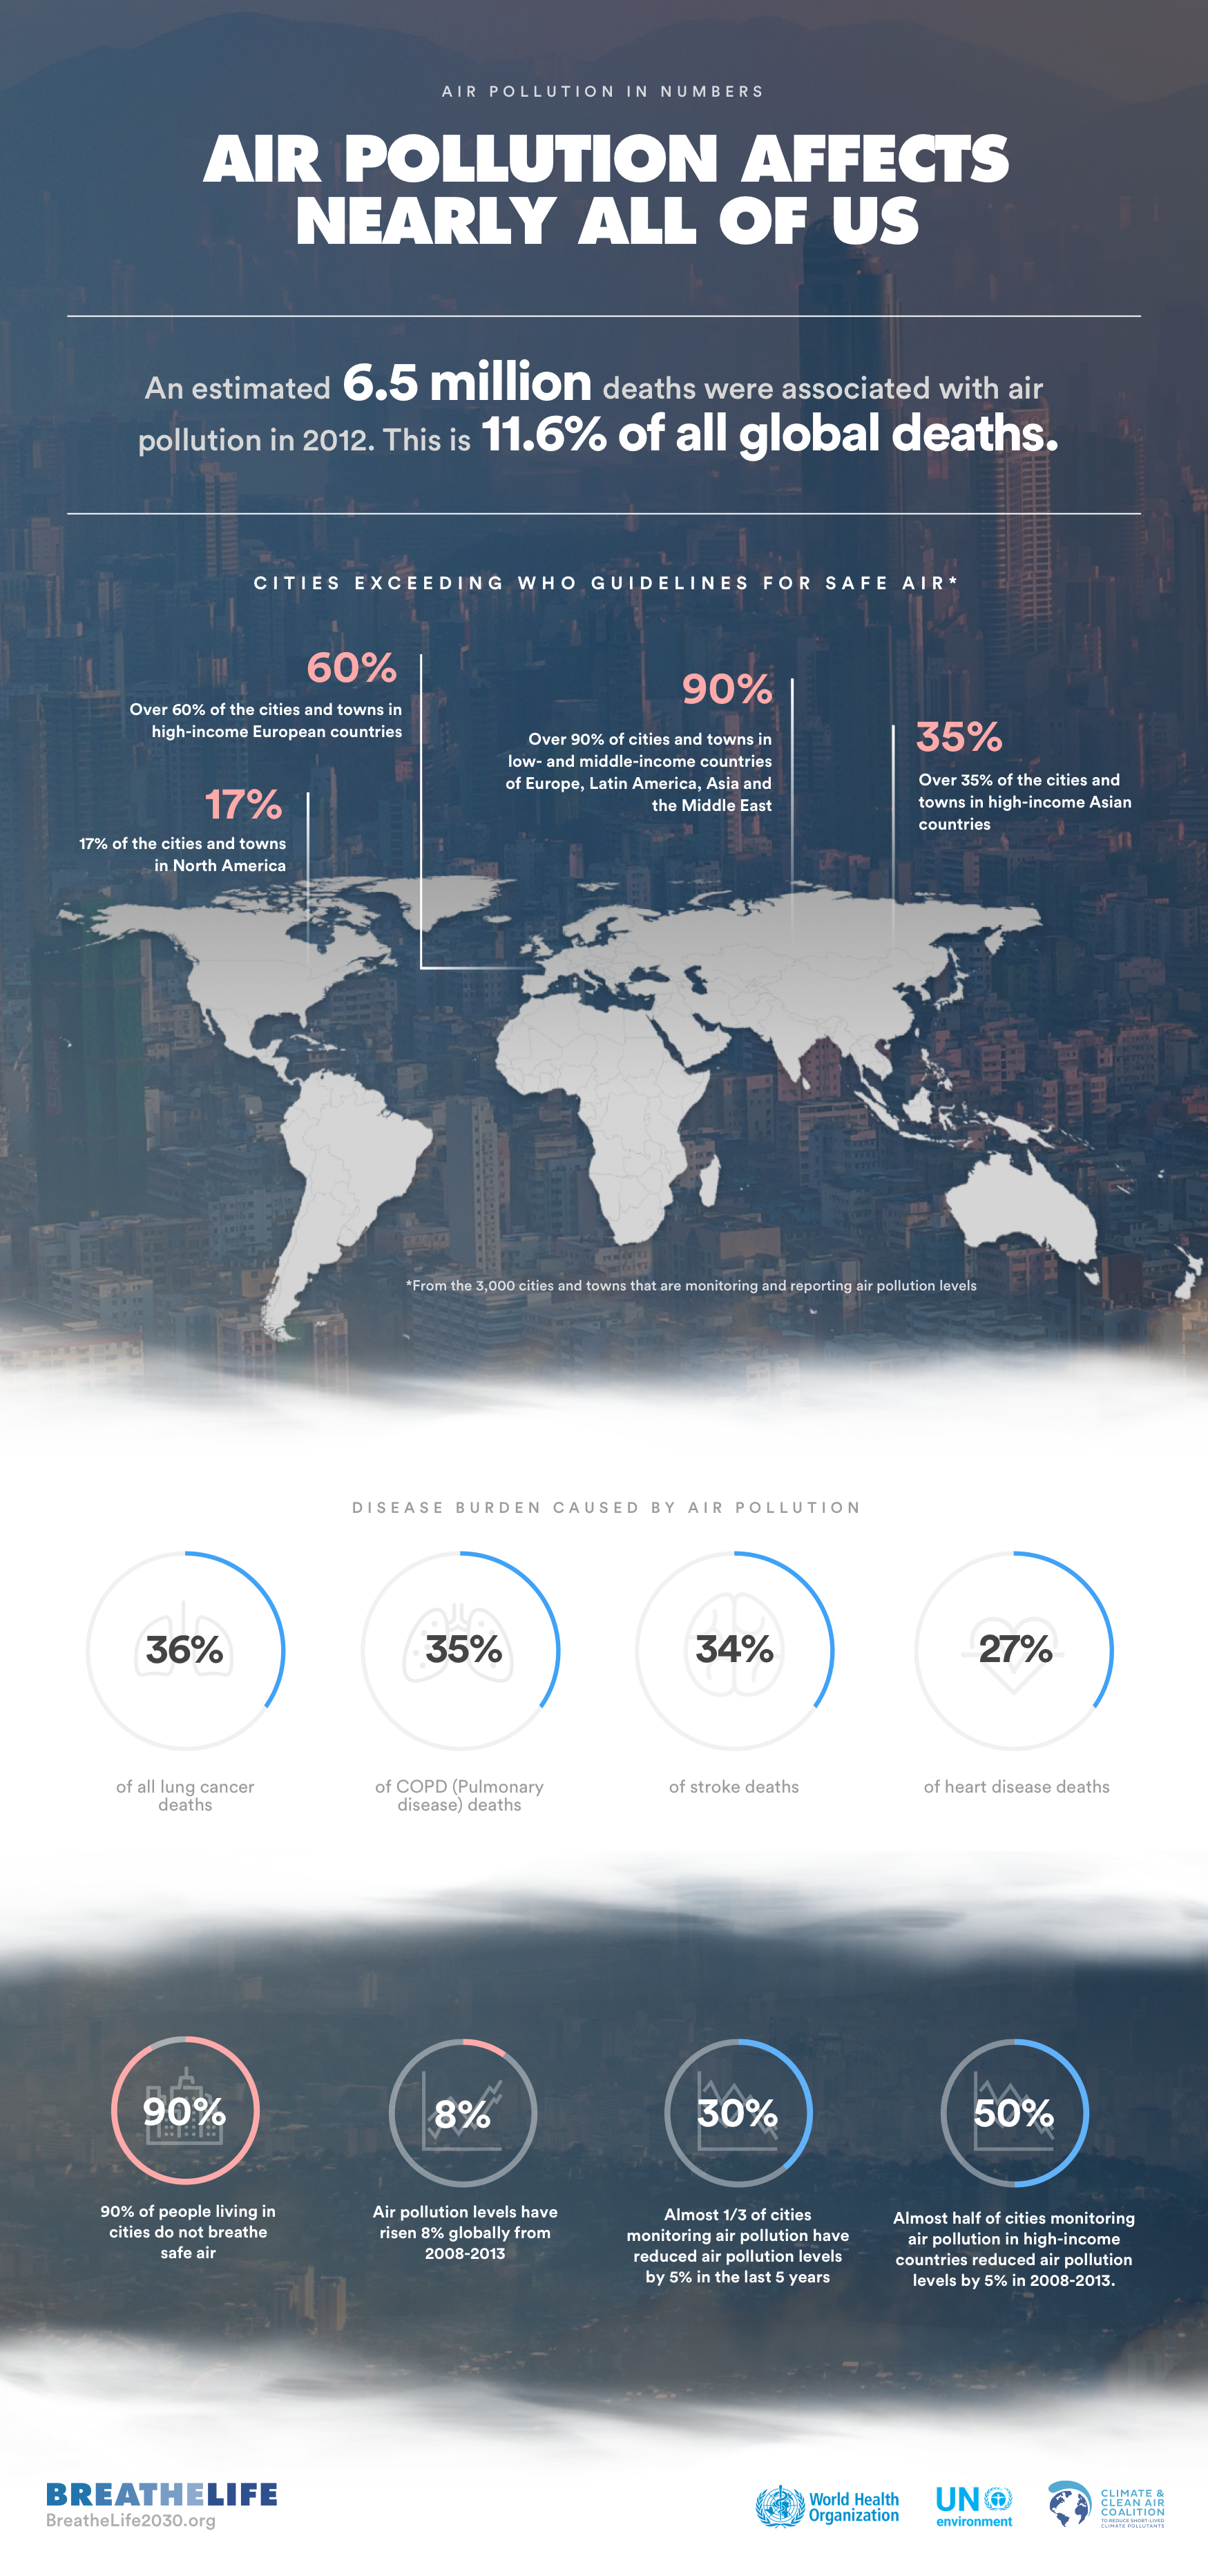
The world still relies heavily on the use of coal for its energy needs, and a third of all energy use is still based on coal. This is happening despite the well-known fact that is the largest contributor to climate change, the least efficient energy resource we have, consumes and contaminates vasts amounts of water, kills 350,000 people a year by causing air pollution from coal-fired power plants, and will leave us in a world that is 4 to 6°C warmer.
Common article angles
- Zooming in: focus on one energy project in your region.
- Zooming out: analyze the emissions patterns of your area’s electricity sector over the years. This is an opportunity to work with data in journalism!
- The policy route: focus on your state’s energy policy and what it means for your area.
- How about your school? Examine the amount of electricity your school consumes and where it comes from.
- Whatever angle you choose, make sure that there’s a human-interest element to your story. This should not be an analytical article that bombards and bores readers with facts and expert opinions
Article-framing questions
- Where does energy in your area/your school come from? Percentage breakdown?
- Does your region import/export energy?
- Is there a particular fossil fuel project (operating, under construction, planned) that has done/will do much damage to the environment in your area?
- How much greenhouse gases will it emit?
- How will it affect people’s quality of life? Will it affect your school?
- Are young people protesting this project? Is the government responding?
Potential sources
- Interviewees (listed in order that you should reach out):
- Primary source: Workers employed at fossil fuel project sites. People living closest to project site. Prioritize those who have lived there for some time.
- School/school district: energy coordinator, sustainability coordinator.
- Neutral expert: energy scientist (from local university, NGO, think-tank, etc…) *BEWARE* Triple-check their credentials and, if possible, where they get funding for their work.
- Government: Local energy committee/department
- Corporate: Whoever funds, plans for, operates, benefits financially from the project.
The Creative: some visualization ideas for the fossil fuel story using Google’s free data visualization app, Flourish
- Bar Chart Race: perfect for comparing between the production/consumption of different energy sources over time. Example: https://public.flourish.studio/visualisation/607729/
- 3D Globe: can demonstrate the fossil fuel financing relationship between different parts of the country/different countries.
AGRICULTURE AND FOOD PRODUCTION
Livestock claims the title of the world’s largest land footprint and is growing fast, with close to 80% of the planet’s agricultural land now used for grazing and animal feed production, even though meat delivers just 18% of our calories.
The UN Climate Report identifies meat consumption as barrier to stay below 1.5°C. Aside from meat production, the agricultural sector worldwide contributes to global warming in other ways – producing 19-29% of global greenhouse gas emissions.
Article angles
- Zooming in: Examine the practices of a local farm, ranch, Cafo,…and their environmental impacts.
- Tracing the source: Tell the carbon footprint story of a popular dish for local youths through each stage of its production (tracing each ingredient) and distribution — in short, from farm to fork.
- Zooming out: analyze the emissions patterns of your area’s agriculture/food production sector over the years. This is an opportunity to work with data in journalism!
Article-framing Questions
- What do young people in your area like to consume? Does it contact animal products? Where do the ingredients for that dish come from?
- What are some locally-grown products in your area? What products have to be transported from far away?
- How is meat produced in your country? What are the environmental impacts?
- Is there a way to produce food that is less harmful to the environment? What would that look like?
- Is a plant-based diet possible in your school? Why or why not?
Potential Sources
-
- Interviewees:
- Primary source: farmers, ranchers, butchers, others involved at any point in the food production chain – and consumers!
- School/school district: energy coordinator, sustainability coordinator.
- Neutral expert/scientist: agronomist, food scientist, etc. (from local university, NGO, think-tank, etc…)
- Government
- Corporate: corporate farms, Cafos, retail markets
- Data:
- US
- Primary source: farmers, ranchers, butchers, others involved at any point in the food production chain – and consumers!
- Interviewees:
The Creative: some visualization ideas for the agriculture story
-
-
-
- Storymap: Tell a visual story of food emissions from (perhaps not a local) farm to table!
- Piktochart: agriculture/food production stories may benefit greatly from some infographics. Why not visualize your favorite dish, with each component and their respective carbon footprint presented? Try out Piktochart or Canva!
- Storymap: Tell a visual story of food emissions from (perhaps not a local) farm to table!
-
-
Other story ideas
Aside from these big polluters, other sectors also contribute greatly to greenhouse gas emissions, including the transportation and chemical production industries, as outlined in the EPA report above. Any of these stories can be told using relatively similar article angles and framing questions.
- Examples:
The loss & damage story
EXTREME WEATHER EVENTS
Climate impacts, such as extreme weather events, heat waves, floods, droughts, will have a direct impact on human health and well-being. The burden is unequally distributed, and some communities are much worse hit than others due to their location or infrastructure.
Article angles
- Zooming in: Tell the story of one extreme weather event and how it has affected your community. Perhaps focus on your school as well as schools in your district.
- The extreme weather event doesn’t have to be recent; you can choose a past event that may not have been reported on extensively.
- Examining Damage: Instead of zooming into a particular event, zoom into a particular type of damage and trace it back to extreme weather event(s) and climate change.
- Has the experience of students at your school changed because many shops closed down after a flood? According to FEMA, 40 percent of small businesses never reopen their doors following a disaster. Have families in your neighborhood been struggling to deal with damp walls and mold in their house after a flood? Write about that!
- The human-interest story: Articles about extreme weather events are perfect opportunities to zoom in on individuals’ stories. Sit down with a primary source – someone who has been personally affected by the flood, and listen to their story! This hour-long interview may turn into a touching feature story or a Question & Answer piece.
- Zooming out: Trace the pattern of extreme weather events over an extended period of time in your area, and what policies have been enacted in response to each.
Article-framing questions
- How does a Hurricane/Storm/the particular weather event you are reporting form?
- How does climate change affect it? Does it increase the water temperature? What does Climate Change do to the Atmosphere and its ability to hold water vapor?
- Does climate change lead to more severe weather disasters?
- Does climate change decrease the community’s resilience in the face of an extreme weather event?
- Who are the most vulnerable members of the community? How vulnerable are school students? Are there any measures in place to protect them?
- Has the loss and damage been properly addressed? Has it exacerbated in recent years?
Potential sources
-
- Interviewees:
- Primary source: people affected by the extreme weather event.
- Neutral expert/scientist: meteorologist, climate scientist (from local university, weather station, etc.)
- Government: any representative from the local government should have something to comment about the disaster. Most relevant source of information should be the mayor, or members of the local disaster management group.
- Others: People associated with institutions that bear the strain of the disaster. For example, emergency team from local hospital, property management of any damaged buildings, etc.
- Data:
- Primary source: people affected by the extreme weather event.
- Interviewees:
The creative: some visualization ideas for the climate disaster story
- Storymap: once again, perfect for displaying chronological events with a map. You can trace the extreme weather event from where it first starts to where it hits, where it causes damage, etc.
- Flourish: try out the app’s map features – Marker map, 3D Globe, Connection Map, etc – which, in comparison to Storymap, are better for showing big-picture things. For example, injuries related to floods in different school districts.
-
-
-
- Google Earth Pro + Juxtapose: Perfect combination for showing changes in the lay of the land before and after a climate disaster or a period of time with drastic changes in climate.
-
-
MIGRATION
Indirect impacts of climate change are also very important, such as changes in infectious disease patterns, air pollution, food insecurity or migration. These oftentimes prove to be the more long-lasting and devastating than the short-term effects. From 2008 to 2018, according to the Internal Displacement Monitoring Center, 265.3 million people “were displaced internally as a response to disasters.”
Furthermore, migrants are often times the more vulnerable groups of people in society, such as women and ethnic minorities. UN Development found that 80 percent of those displaced by climate change are women.
Article angles
- Zooming in: Tell the story of one large migration or relocation induced by the symptoms er affects of climate change.
- Zooming out: Trace the pattern of migration in your area (state/province/country/region) and whether it has any correlation to climate disasters or long-term climate impacts.
- The Human-interest story: Even more so than the short-term climate disaster story, the long-term climate migration story is the perfect opportunity to do an in-depth feature about a particular individual and their family — how their life was affected by climate change, how they made the decision to relocate, how life is for them now. Perhaps a student who currently goes to your school?
Article-framing questions
- What are the causes that led to a specific person/a group of people’s migration? Are any of them symptoms or consequences of climate change?
- Has there been any recognition of their status as climate migrants?
- What difficulties did they face during their journey and the relocation period afterwards?
- Do these climate migrants plan to come back? Is it possible for them to come back?
- What policy changes are necessary to change the current situation?
Potential sources
-
- Interviewees:
- Primary source: people induced to relocate because of a climate disaster or a series of climate disasters.
- Neutral expert/scientist: on climate migration, or general immigration
- Government: any representative from the local government where climate migrants now reside, or the area that they left.
- Others: People working for non-profit organizations helping the climate migrants relocate or settle down in their new home.
- Data:
- Primary source: people induced to relocate because of a climate disaster or a series of climate disasters.
- Interviewees:
The creative: some visualization ideas for the climate disaster story
- Storymap: You can easily trace the migrants from their original homes to their destinations and tell a compelling story with this chronological map.
- Piktochart/Canva: Perhaps a few infographics to explain climate migration? These two apps will help you with this.
- Other story ideas: In the examples above, we’ve only looked at climate loss and damage on human systems. When you consider natural systems, for example, the distribution of animal and plant species, a host of important stories arise that also sorely need to be told. Check out this post for some examples.
- Examples:
- A look at climate impact in the Bay area
- Page 4, “The Real Whirlwind: The Dangers of Climate Change” https://issuu.com/mbscommunications/docs/oct2018?e=9077451/67063172
- An article about climate impact on Vietnamese ethnic minorities published by VN Economic Times
- An Article examining how hurricanes Harvey and Urma affected students
- An op-ed examining Californian forest fires
- Not an article, but…. a series of excellent podcasts on climate impact created by students in the wake of the 4th national climate assessment.
The solar panel story
Article angles
- Zooming in: Tell the story of one renewable energy project that has recently been installed in your school or your community.
- Zooming out: Tell the story of renewable energy development in your community since it began, the forces at play that made it possible, the roadblocks and the rewards. This is an opportunity to work with data in journalism!
- The potential: Perhaps your community has yet to develop meaningful renewable energy projects? Identify the potential and investigate into whether something that has been done elsewhere can be applicable to you! Or perhaps, someone in your community is already conducting research that may be applied in the future?
Article-framing questions
- Does your community use renewable energy? If yes, is it produced locally or imported from another source?
- What do residents think about using renewables? Are there households that employ small-scale renewables, such as solar batteries and biogas/biofuels?
- Is renewable energy considered too expensive? Is it actually?
- What is the local capacity for renewable energy development? Is your area known for having much sunlight or wind?
- Does your school use renewable energy?
- Is there local research going on in renewable energy development?
Potential sources
-
- Interviewees:
- Primary source: residents using renewables in their daily life, managers and workers at renewable energy projects
- Neutral expert/scientist: energy scientist from local university.
- Government: town energy committee – or any local government official
- Others: People associated with institutions that bear the strain of the disaster. For example, emergency team from local hospital, property management of any damaged buildings, etc.
- Data:
- Primary source: residents using renewables in their daily life, managers and workers at renewable energy projects
- Interviewees:
The Creative: some visualization ideas for the renewable energy story
- Flourish: Need to create a few graphs to illustrate changing trends over time? Flourish Bar Chart Race is once again the perfect tool.
- Piktochart/Canva: Perhaps a few infographics to explain renewable energy on the backdrop of a clipart map of your area? These two apps will help you with this.
- Examples:
Strike action / protests
Article angles
- Zooming in: Write about one particular climate strike event in your area, following the organizers from their early planning stages to the event itself and its achievements.
- Human-interest story: Focus on the youth groups organizing the event or individual organizers with interesting perspectives (be careful with this approach so as not to make it seem like you’re dismissing others’ efforts). Trace their story from when they formed an organizing team, their first protests, their growth over time and what they are planning to do now.
- Focus on the Achievements: Tell the story of what happens after a strike action rather than the event itself. This can be the signing and presenting of a petition, some concrete policy or practice change, etc.
Article-framing Questions
- What climate action events are there in your area?
- Who organized these events?
- Why are they protesting? Are they rallying against a particular polluter, a government decision or lack thereof?
- How was the protest organized?
- What was the scale of the event?
- Has it led to any concrete responses from the government or responsible corporations?
- Has it led to any concrete actions from the government or responsible corporations?
- Are there plans for follow-ups in the future?
Potential Sources
-
- Interviewees:
- Primary source: primary organizers of each action and the protesters.
- Adults: teachers supportive of the strikes (although the adult perspective in such articles are less important and could be omitted)
- Government: head of local government where the action event is organized.
- Police: if they are involved in the action event.
- Others: if the action event targets certain climate polluters, for example, fossil fuel companies or financers, try to obtain their perspective as well!
- Data:
- Adults: teachers supportive of the strikes (although the adult perspective in such articles are less important and could be omitted)
- Primary source: primary organizers of each action and the protesters.
- Interviewees:
The Creative: some visualization ideas for the climate action story
- Timeline : A great tool for telling stories with references to dates on a timeline. Perfect for articles detailing a climate action group’s formation and key steps in planning and executing an event.
- Storymap: Same idea as Timeline, but more focus on the location of events rather than the time, though chronology can still be displayed.
Other story ideas: Striking and protesting are not the only forms of climate activism. Look at community initiatives such as activism through art and activism through the media for more story ideas to write about!